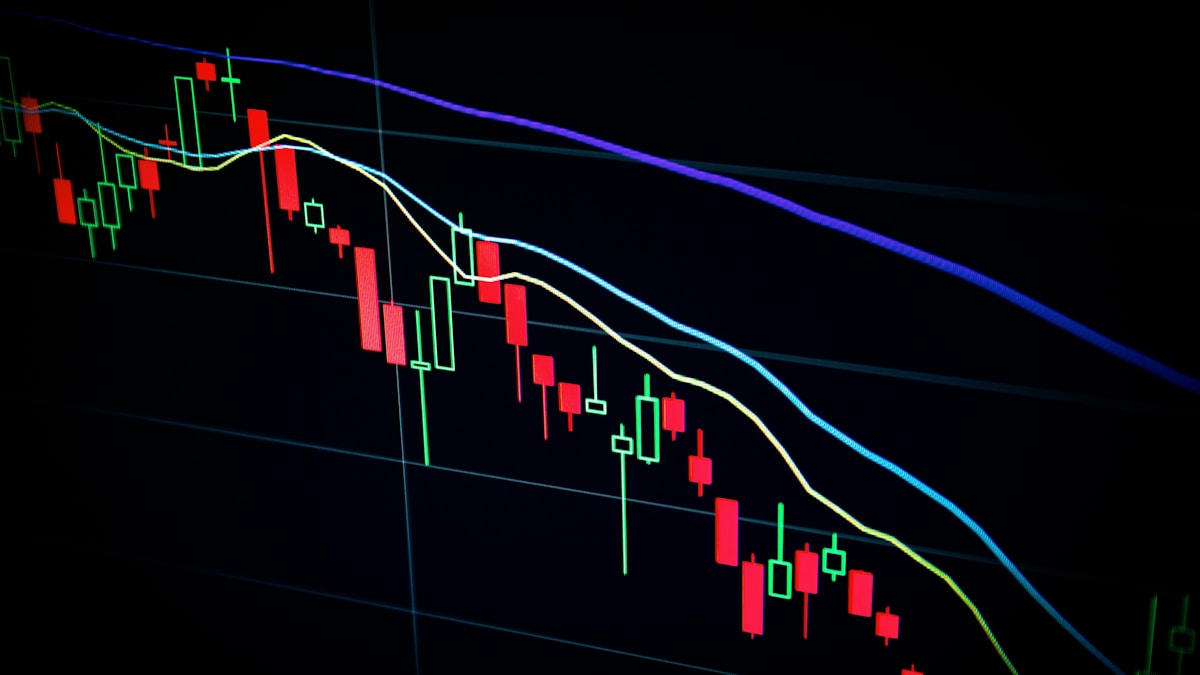
How to Read Crypto Charts: Technical Analysis for Beginners
Master the basics of reading candlestick charts, identifying support and resistance levels, using moving averages, and recognizing chart patterns for trading decisions.

Technical chart structures, macro liquidity indicators, on-chain valuation models, and tokenomics.
Master the basics of reading candlestick charts, identifying support and resistance levels, using moving averages, and recognizing chart patterns for trading decisions.
Understand how circulating market cap and fully diluted valuation (FDV) provide critical insights into token supply dynamics and valuation.
Examine the psychological, technical, tax, and risk differences between active day trading, swing trading, and long-term crypto investing.
Understand derivative instruments including futures contracts, perpetual swaps, leverage, funding rates, and the risks of leveraged crypto trading.
Learn how to evaluate crypto projects through token emission schedules, vesting cliffs, inflation rates, staking rewards, and utility models.
Understand cryptocurrency ETFs, the SEC approval process for spot Bitcoin and Ethereum ETFs, and their impact on institutional crypto adoption.
Understand multi-year market cycles, Bitcoin halving seasonality, liquidity macro conditions, and risk management strategies during market swings.
Analyze how large holders known as whales move markets through accumulation, distribution, and the visibility of on-chain wallet tracking.
Discover why digital asset markets experience high price volatility, how leverage cascades trigger liquidations, and how to measure volatility.
Master the four phases of crypto market cycles: accumulation, markup, distribution, and markdown, using on-chain metrics and sentiment analysis.